import numpy as np
import matplotlib.pyplot as plt

x = np.linspace(0, 2 * np.pi, 200)
plt.plot(x, np.sin(x))
plt.show()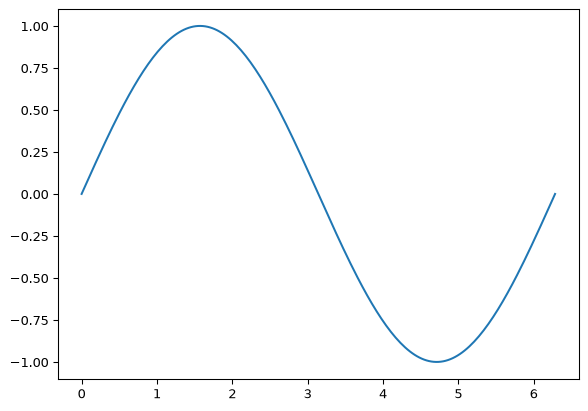
Hello. This post renders a figure from Python at build time:
import numpy as np
import matplotlib.pyplot as plt
x = np.linspace(0, 2 * np.pi, 200)
plt.plot(x, np.sin(x))
plt.show()Inline math works too: \(e^{i\pi} + 1 = 0\).